Every year, Gartner recognizes the top BI tools in its Magic Quadrant for Analytics and BI Platforms. Tableau has been recognized as a leader in this report over the past decade. However, in 2019, the industry witnessed the rise of a new market leader – Power BI.
Here’s what attributed to Tableau losing the top spot:
- General Shift Toward Cloud Ecosystem – Many companies started exploring cloud-based analytics and BI solutions for the advantages they bring to the table, like scalability, shorter deployment time and mobility. This was not Tableau’s area of focus as it had built its legacy through on-premises deployments. Although Tableau has made significant improvements on this front in recent years, its competitors were already one step ahead.
- Heavy Focus on Integration with Salesforce – Salesforce acquired Tableau in 2019 with an aim to enable self-service analytics for everyone on Salesforce Customer 360. With the focus on integrating Tableau with Salesforce, additional development took a back seat.
- High Total Cost of Ownership – Tableau creator licenses cost $70 per month, which is 7 times more than the Power BI license fee. Although there are deeper differences in these licensing models, for a company with a tight BI budget, Power BI is the obvious choice.
Microsoft Power BI first challenged Tableau in 2017, and it has held the top spot in Gartner’s Magic Quadrant since 2019. Nearly 90% of the Fortune 500 are migrating from Tableau to Power BI. Over the past year, we have been seeing this in a very accelerated way. Here’s why:
- Power BI offers greater flexibility in connecting to third-party data systems.
- Seamless integration with the Microsoft suite, which has about 48% of market share.
- One of the lowest licensing costs in the BI landscape.
- Superior data modeling tools compared to other BI tools.
So, you’re probably wondering, with such significant benefits, why hasn’t everyone already migrated to Power BI? Well, it’s no easy feat – with multiple variables at play like defining the business case, change management, lack of data modeling capabilities and difficulty proving ROI for the overall migration activity.
However, the biggest roadblock for most companies has been the implementation time, which can range from a couple of months to years, depending on the number of existing reports and dashboards and the data sources. Also, converting Tableau queries to DAX queries can expand your timeline by weeks as they need to be manually converted for each calculated field.
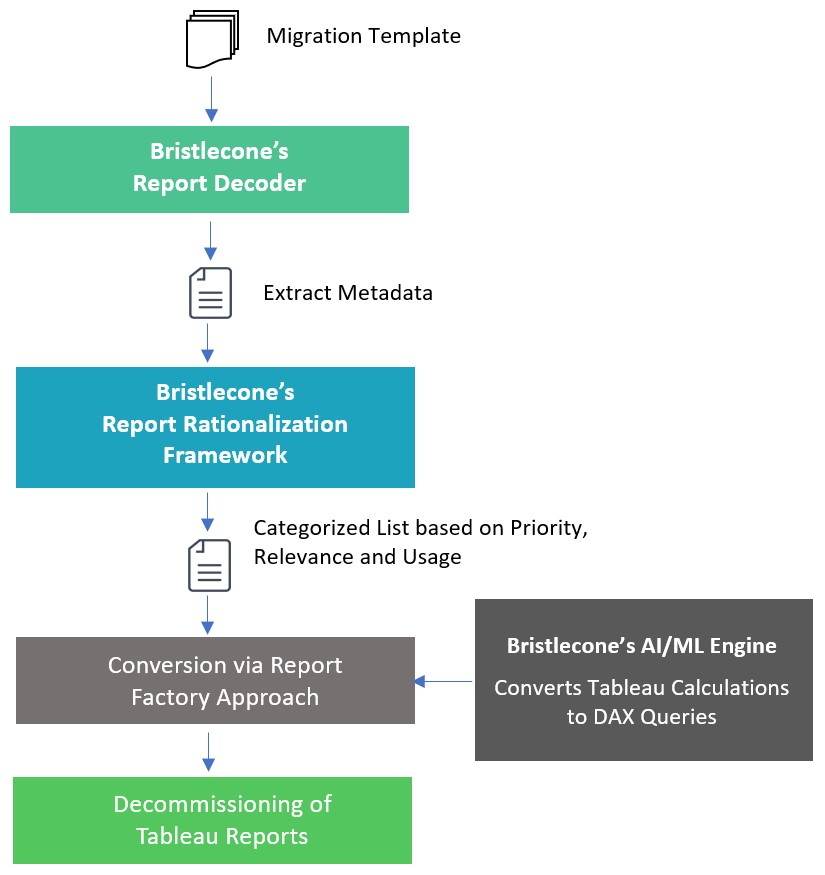
Bristlecone’s Tableau to Power BI (TPBI) framework allows you to migrate all your Tableau dashboards to Power BI with minimal human intervention, resulting in shorter execution time. Using our AI/ML engine, we can convert your Tableau queries to DAX queries with over 80% accuracy. Combining this with our report rationalization framework to classify your reports into different categories based on their usage and insights offered, you can optimize the total number of dashboards even before you migrate them to Power BI.

Overall, Bristlecone’s TPBI framework can reduce your Tableau to Power BI migration timeline by over 40% compared to other conventional methods. Coupled with our report rationalization solution, the TPBI framework can optimize your ROI by reducing the IT infrastructure and maintenance costs by almost 30%.
Tableau to Power BI migrations will only be successful when you enable end users to leverage Power BI effectively. Our customized training modules and user enablement sessions will help you close the knowledge gap. And our team of Power BI experts will help you curate learning journeys tailored to your BI maturity and ensure a holistic tool enablement for your BI team.
If you are considering a shift from Tableau to Power BI, let’s talk. We would love to help you accelerate your migration, while driving a data culture and establishing a strong foundation for BI success. (No BI tools in place yet? We can help with that, too.)


